
If your current local SEO report is just a list of keyword rankings and website visitors, you’re looking at vanity metrics. It's data that looks impressive on a chart but fails to answer the one question every business owner has: is this actually making the phone ring?
A report should be a business intelligence tool, not a digital report card. It needs to give you clarity on what's working so you can double down, and what's failing so you can fix it—fast.
Why Most Local SEO Reports Are Useless
Let's be blunt. For a contractor in Menifee, knowing you rank #3 for "kitchen remodels" is pointless if your schedule isn't booking up. The problem is, most traditional reports are built to impress, not to inform. They’re packed with data that looks good instead of data that does good.
These reports are usually stuffed with metrics that have no clear connection to real-world business outcomes. Things like "impressions" and even overall website traffic are secondary. They tell you people saw you, not that they chose you.
The Problem with Vanity Metrics
Vanity metrics are the digital equivalent of counting how many cars drive past your storefront. Sure, it's interesting, but it doesn't tell you how many people walked in the door and bought something. A valuable local SEO reporting strategy goes much deeper.
It’s about connecting every data point back to revenue and customer acquisition.
A great local SEO report doesn't just show you data; it tells you a story about your customers. It reveals where they come from, what they need, and how they found you, giving you a roadmap to find more people just like them.
Redefining a Valuable Report
So, what does a report that’s actually useful look like? It puts metrics that directly measure customer intent and action front and center. Instead of just listing rankings, it should answer the critical business questions that keep you up at night.
- Which of my services is generating the most phone calls? This tells you where to focus your marketing budget.
- Are we getting more direction requests to our shop this month? This is a direct measure of real-world foot traffic.
- How many people submitted a "Request a Quote" form after finding us on Google Maps? This connects your online visibility directly to qualified leads.
This shift transforms your local SEO reporting from a passive document into an active, strategic tool for your business. It stops being about looking good online and starts being about growing your bottom line. We build our reports to provide this level of insight, ensuring you see exactly how your website is generating real leads and paying customers, not just clicks.
Building Your Actionable Reporting Dashboard
You don't need fancy, expensive software to build a command center for your local marketing. You can create a powerful dashboard using free tools you likely already use. The goal isn't a monster spreadsheet; it’s a single source of truth you can glance at for five minutes and know exactly where things stand.
A great SEO Performance Dashboard is the heart of any solid local SEO report, giving you a clear overview of the metrics that actually matter. The best ones pull critical data from three core platforms: Google Business Profile, Google Analytics 4, and Google Search Console.
Let's walk through how to connect these dots.
Essential Metrics for Your Local SEO Dashboard
To get started, we move past vanity metrics and focus on what truly drives business. The table below outlines the must-have data points from each tool and, more importantly, why each one matters. This isn't just about collecting numbers; it's about understanding the "why" behind them.
| Metric | Source Tool | What It Measures |
|---|---|---|
| Phone Calls | Google Business Profile | The number of direct leads calling your business from your GBP listing. This is a primary conversion point. |
| Direction Requests | Google Business Profile | A strong indicator of foot traffic and intent to visit your physical location. Essential for brick-and-mortar stores. |
| Website Clicks (from GBP) | Google Business Profile | High-intent users who clicked from the Local Pack or Maps to learn more on your site. |
| Local Organic Sessions | Google Analytics 4 | The volume of website visitors from organic search who are physically located in your target service area. |
| Local Website Conversions | Google Analytics 4 | How many of those local visitors completed a goal, like filling out a contact form or clicking to call. |
| Top Local Keyword Clicks | Google Search Console | Clicks from high-intent, location-based searches (e.g., "plumber in Temecula") that drive qualified traffic. |
By pulling these specific metrics together, you're building a dashboard that connects your online efforts directly to real-world business outcomes. It’s about measuring actions, not just visibility.
Starting with Google Business Profile Insights
Think of your Google Business Profile (GBP) as your digital storefront. The insights it provides are the most direct measure of how local customers are interacting with your business. This is where you see people shift from discovery to action.
Forget getting bogged down in "views." We zero in on the actions that signal real commercial intent.
When setting up your dashboard, pull these specific metrics that translate directly into potential business:
- Phone Calls: This is the gold standard. Track the number of calls initiated right from your GBP listing month over month. A steady climb here is one of the clearest signs your local visibility is turning into tangible leads.
- Direction Requests: For any business with a physical storefront, from an auto shop to a dental office, this is a powerful proxy for foot traffic. An uptick means more people are planning to walk through your door.
- Website Clicks from GBP: These aren't random visitors. These are high-intent users who found you on Google Maps or in the Local Pack and are one click away from becoming a customer.
This simple visual breaks down the crucial shift from a vanity report to an actionable one that measures real customer behavior.
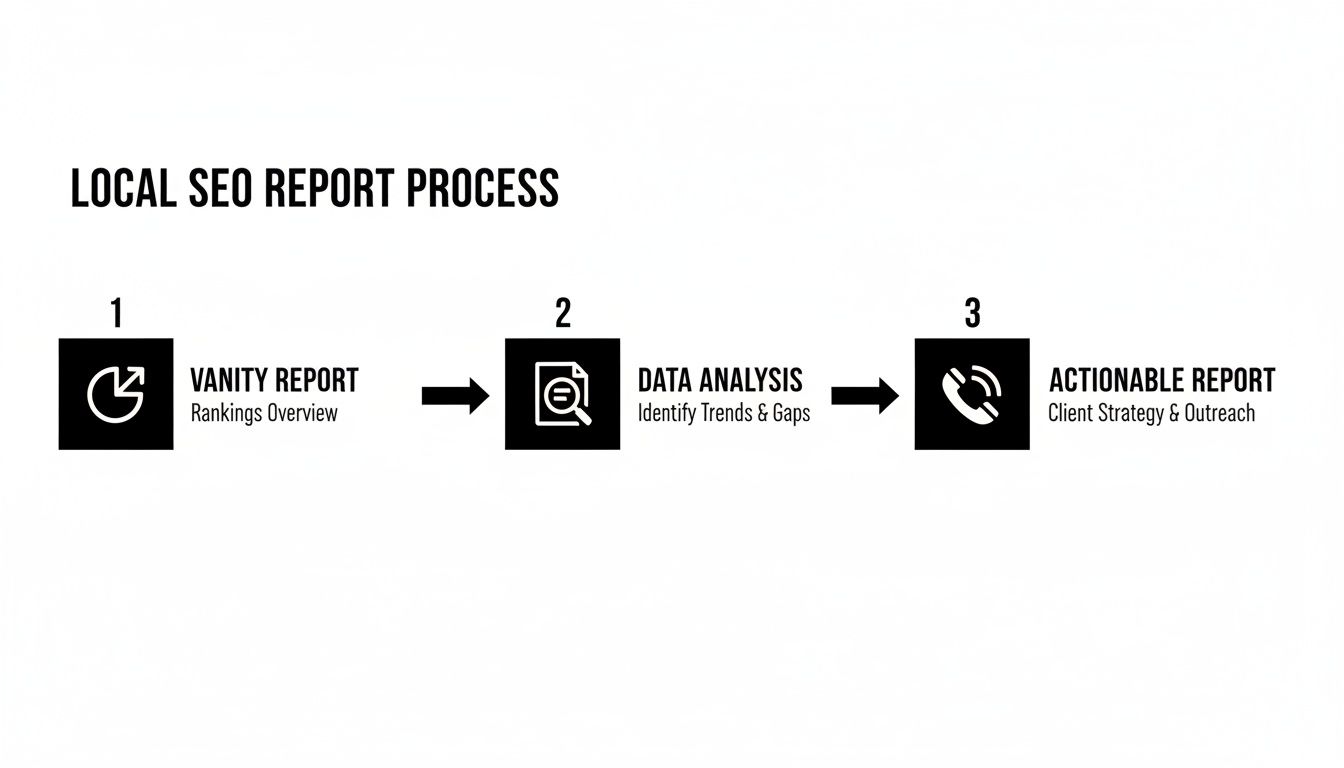
The goal is to move past passive data and start tracking the interactions that directly impact your bottom line.
Connecting Your Website Performance with GA4
Next, we'll pull in website data using Google Analytics 4 (GA4). The secret isn't to track all traffic—it's to isolate the traffic that actually matters to your local business. Generic traffic numbers are useless; the real gold is in geographically segmented data.
For example, a contractor based in Murrieta needs to know if their website is attracting homeowners from Murrieta and Temecula, not from halfway across the country.
Your dashboard must answer one simple question: "Is my website attracting potential customers from my actual service area?" If it can't do that, it's not working hard enough for you.
To get this answer, create a segment in GA4 that filters traffic by geographic location. Once that's set up, pull these two data points into your dashboard:
- Local Organic Sessions: The total number of website visits from organic search that came from users within your specific service cities or zip codes.
- Local Website Conversions: This tracks how many of those local visitors took a valuable action, like submitting a "Request a Quote" form.
This approach gives you a clear picture of whether your https://uncommonwebdesign.com/seo-experts/seo-for-service-based-business/ efforts are hitting the mark. It removes the noise from irrelevant traffic and connects your website's performance directly to your target market.
Tying It All Together with Google Search Console
Finally, let’s bring in Google Search Console (GSC). This tool tells you how local customers are finding you. It provides the context behind your traffic, revealing the exact search terms people are typing into Google.
This isn't about chasing rankings for every keyword. It's about identifying and tracking the performance of the high-intent, location-based keywords that actually drive business. These are your "money" terms.
Focus on these two areas:
- Top "Near Me" & Local Queries: Pinpoint searches like "plumber near me" or "auto repair in Menifee" that are driving clicks to your site. A growing number of clicks from these terms is a powerful indicator that your local SEO is working.
- Clicks vs. Impressions for Local Terms: Keep an eye on the click-through rate (CTR) for your most important local keywords. If you have tons of impressions but a low CTR, it might mean your page title or meta description isn't compelling enough to earn the click.
By pulling these carefully selected data points from each of these free tools, you're not just looking at isolated numbers. You're building a focused, actionable reporting dashboard that tells an interconnected story—a story of how your online presence generates real-world business opportunities.
The Metrics That Truly Matter for Local Businesses
Impressions and clicks are just noise if they don't lead to new business. For a local service company, success isn’t measured by how many people see your website; it's measured by how many appointments you book. Your local SEO reporting has to reflect this reality.
It's time to stop chasing vanity metrics and start tracking the key performance indicators (KPIs) that actually put money in the bank. Whether you run a dental office in Temecula or an auto shop in Murrieta, the goal is the same: turn online visibility into paying customers.
Google Business Profile Actions: The Gold Standard
Your Google Business Profile (GBP) is your most valuable piece of digital real estate. It’s often the first and only interaction a potential customer has with your business online. The actions they take there are the purest signals of commercial intent you can find.
A truly useful local SEO report puts these interactions front and center.
- Phone Calls: This is the big one. A customer who calls directly from your GBP listing is a high-intent lead, ready to book a service.
- Direction Requests: This metric is a direct proxy for foot traffic. Someone clicking for directions is literally planning a trip to your physical location.
- Website Clicks: Clicks from GBP aren't random traffic. These are qualified users who found you on Maps or in the Local Pack and are now actively seeking more information on your site.
For a local business, a 20% increase in direction requests is infinitely more valuable than a 20% increase in website traffic from another state. One metric fills your waiting room; the other just inflates a number on a chart.
Local Organic Traffic and Conversion Analysis
The story continues once a potential customer clicks through to your website. It’s not enough to know how many people visit; you need to know who they are and what they do next. This is about filtering out the noise to focus on visitors from your actual service area.
An influx of website visitors from across the country might look good on a graph, but it does nothing for a local contractor. Your reporting must segment traffic by geography to confirm you're attracting the right audience. You can learn more in our guide on local SEO best practices.
This is where we connect website performance to tangible business goals. We have to answer two critical questions:
- Are we attracting visitors from our target cities and neighborhoods?
- Are those local visitors taking the action we want them to (like filling out a form or calling)?
Analyzing organic traffic by location shows you which geographic markets are driving real demand. This helps you align your marketing with high-value opportunities. As search evolves, it's also vital to consider which geo metrics will provide a competitive edge.
Review Velocity and Sentiment: The Trust Signal
In the local space, your reputation is everything. Online reviews are one of the most powerful trust signals for both potential customers and search engines. A steady stream of positive reviews directly impacts your visibility in the Local Pack and your conversion rate.
Because of this, your local SEO reporting has to track more than just your average star rating.
We focus on two key reputation metrics that tell a much deeper story:
- Review Velocity: This measures the frequency of new reviews. A consistent flow of recent feedback signals that your business is active, popular, and trustworthy. Google notices this.
- Sentiment Analysis: This goes beyond the star rating to look at the themes and language people use in their reviews. Are customers constantly praising your friendly staff or quick service? This feedback is marketing gold.
A sudden drop in review velocity can be an early warning sign, while a surge in positive sentiment confirms your operations are hitting the mark. Tracking this allows you to proactively manage your reputation, a core part of sustainable local growth.
How to Analyze Your Report for Growth Opportunities
A report full of numbers is useless until you learn how to read the story it’s telling you. This is where your local SEO reporting stops being a backward-looking summary and becomes your roadmap for growth.
The point isn't to just glance at data; it's to ask smarter questions. Solid analysis turns raw information into a real-world action plan, helping you spot the opportunities your competitors are missing.
Ask the Right Business Questions
Before you get lost in charts, start with the questions that actually matter to your bottom line. Frame your analysis around finding what’s working, what's broken, and where the hidden potential lies.
Every month, your report should help you answer questions like these:
- Which of our services is driving the most phone calls? This tells you where customer demand is highest. Maybe it's time to feature that service more prominently on your homepage.
- Is our visibility stronger in Murrieta than in Temecula, and why? Seeing these geographic trends helps you understand where you’re winning and where you might need to create more location-specific content.
- Did that blog post about "emergency plumbing" actually lead to more contact form fills? This is how you directly connect your content efforts to real leads, proving the ROI of what you publish.
Asking these kinds of questions forces you to look at the data through a business owner’s lens. It’s not about doing SEO for the sake of SEO; it's about using this data to make better business decisions.
Spotting Trends That Signal Opportunity or Trouble
Your data will rarely stay flat. The real gold is in the trends—the gradual climbs and the sudden drops—and figuring out why they're happening. A single month’s data is a snapshot; the trend over three or six months tells the full story.
Keep an eye out for patterns like these:
- The Unexpected Win: You suddenly notice a flood of website visitors from a neighboring town you don't even market to. That's not a fluke; it's an opportunity. It means an untapped market is actively looking for what you offer.
- The Silent Alarm: Your requests for driving directions from your Google Business Profile tanked by 30% this month. This is a massive red flag. It could mean anything from an issue with your Google Maps listing to a new competitor opening down the street.
Your report is your business's early warning system. A drop in a key metric isn't a failure—it's a notification that something needs your attention before it becomes a real problem.
By regularly scanning for these trends, you shift from being reactive to proactive. You can jump on opportunities before they disappear and fix problems before they start costing you money.
Turning Insights into an Action Plan
This is where the rubber meets the road. Analysis without action is a waste of time. Once you've spotted a key trend or answered a big question, you have to decide what you’re going to do about it.
Your action plan doesn't need to be an elaborate document. A simple list of takeaways and next steps is all you need.
Let’s say you found that your "Commercial HVAC Repair" page is getting tons of local traffic, but almost no one is filling out the contact form. Here’s what your analysis and action plan could look like:
Insight: High traffic, low conversion on the commercial HVAC page.
Hypothesis: The page isn’t resonating with our target audience, or the call-to-action is weak.
Action Plan:
- This week: Add testimonials from three top commercial clients to the page to build trust.
- Next week: Tweak the main headline to focus on "24/7 Emergency Repairs" to hit on a major pain point.
- Next month: Check the report again to see if those changes moved the needle on form submissions.
This simple process closes the loop. It guarantees that the time you invest in your local SEO reporting leads directly to specific, measurable actions that improve your results. This is how you create a cycle of continuous improvement.
Bringing It All Together: Automating and Presenting Your Local SEO Report
As a business owner, you don't have time to manually pull numbers from three different platforms every month. The goal is to get critical insights delivered to you automatically, so you can focus on making decisions, not collecting data.
This is where automation becomes your best friend. Tools like Google Looker Studio are perfect for this. You can connect it directly to your Google Analytics, Business Profile, and Search Console accounts. Once set up, it will pop a clean, concise dashboard into your inbox on the first of every month. No manual work needed.
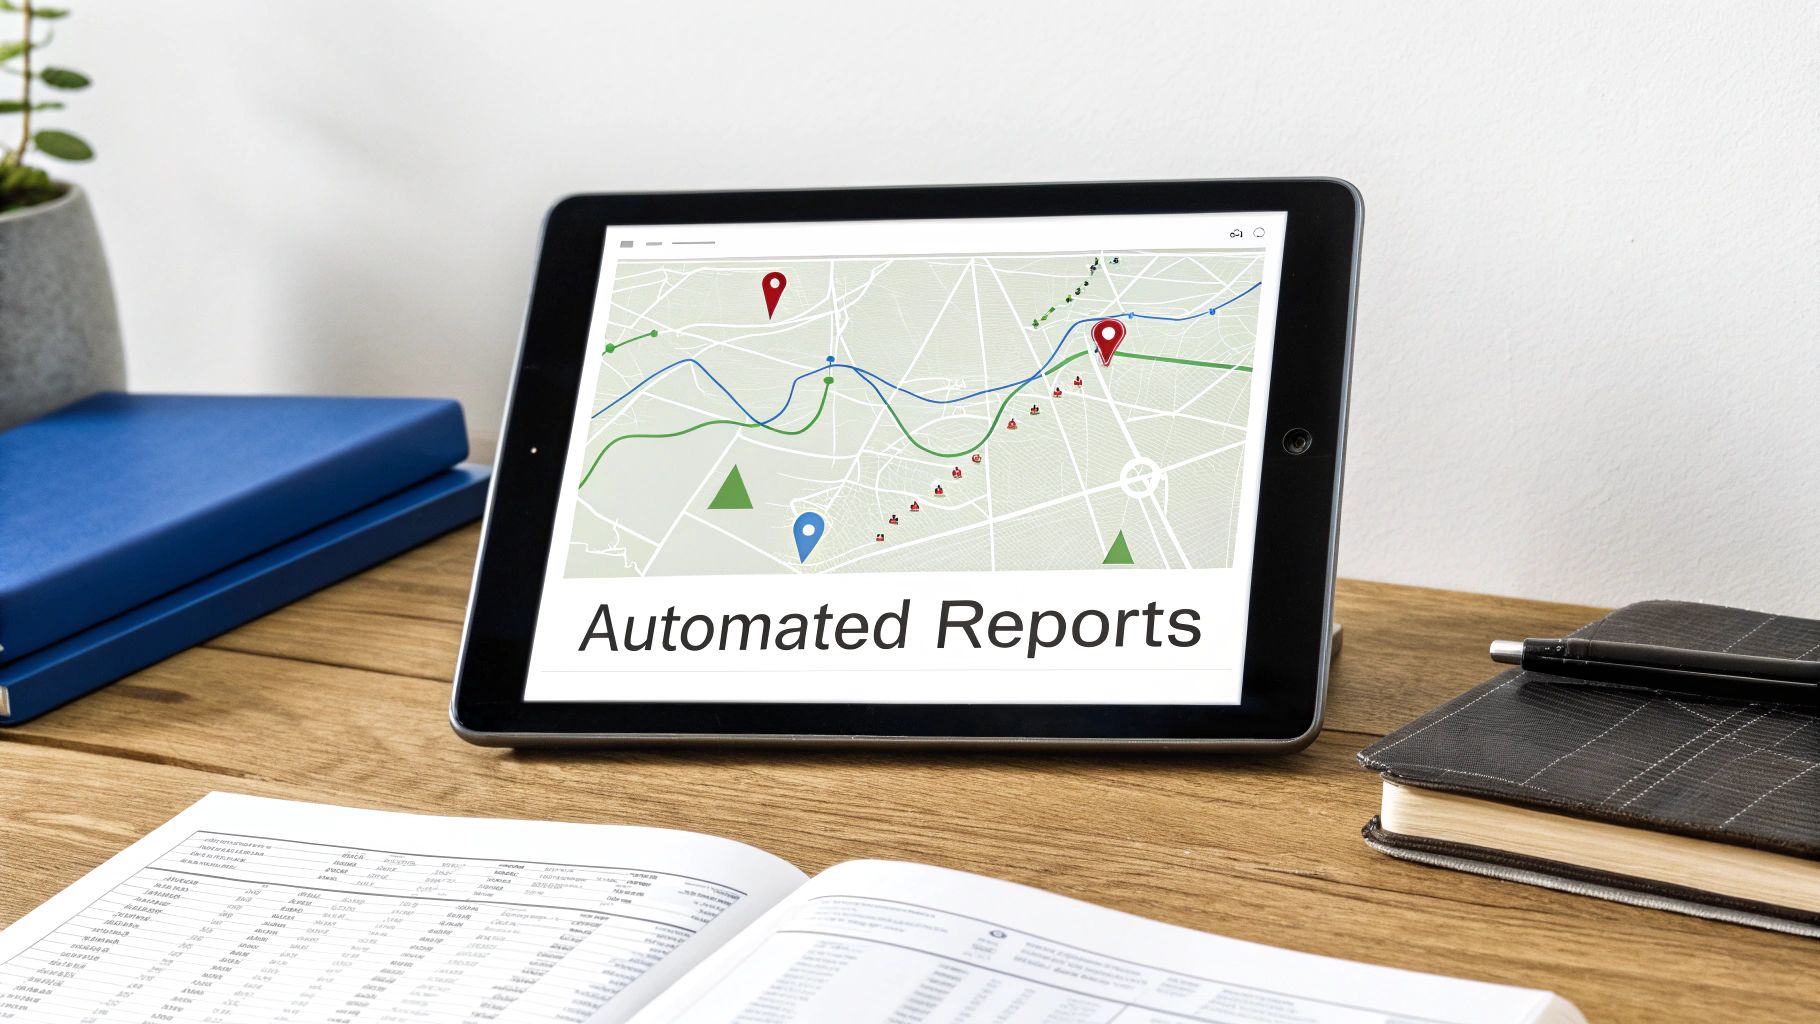
Suddenly, your local SEO reporting shifts from a tedious chore into a seamless part of your business intelligence workflow.
Focus on Visuals That Tell a Story
An automated report is useless if it’s just a spreadsheet of numbers. The magic happens with effective data visualization. This isn't about making flashy charts; it's about presenting complex information in a way you can grasp in seconds.
A well-designed dashboard should immediately pull your attention to what matters most.
Here are a few examples:
- Geographic Performance Maps: Imagine a simple map of your service area with color-coded "hotspots." You might instantly see you're getting tons of direction requests from Murrieta but almost none from Menifee. Boom—that’s a clear opportunity.
- Simple Trend Lines: Instead of just seeing this month's phone call count, a trend line tracks performance over the last six or twelve months. This gives you the bigger picture and helps you spot a real trend versus a random fluctuation.
- Conversion Funnels: A simple bar chart can show how many people saw your Google Business Profile, how many clicked your website, and how many of those filled out a contact form. It’s the easiest way to visualize where potential customers might be dropping off.
The point is to create a report that isn't just for SEO nerds. It should be clear enough for your entire team to understand what’s working and what isn't.
Presenting Data to Drive Action
Once you have your automated, visually clear report, the final piece is knowing how to use it. The objective is always the same: celebrate wins, pinpoint challenges, and keep everyone focused on turning your online presence into a predictable source of new customers.
A report shouldn’t be a document you file away. It should be the agenda for your monthly growth meeting, sparking conversations about what to do next to attract more of your ideal customers.
When you review your report, frame the conversation around these three areas. It’s a simple structure that keeps the discussion productive.
The Wins: What Went Well?
Always start by celebrating what worked. Did phone calls from your Google profile jump by 15%? Acknowledge it. This reinforces the value of your efforts and builds momentum.
The Challenges: What Needs Attention?
Next, tackle the areas that need a closer look. Maybe website conversions from a key service page dropped off. This is where you identify problems before they get out of hand. For a deeper look, consider how integrating a CRM with your website can offer even more clarity.
The Opportunities: Where Do We Go Next?
Finally, translate your findings into a concrete plan. Based on the data, what's the single most important thing you can do next month to move the needle? Perhaps it’s time to update your top-performing service page or launch a campaign to get more reviews.
This approach transforms your local SEO reporting from a passive summary into an active, strategic tool. It ensures every piece of data leads directly to an action designed to grow your business.
Answering Your Top Questions About Local SEO Reporting
We get it. You're busy running your business, and the last thing you need is another report full of confusing jargon. Let's cut through the noise and answer the most common questions we hear.
How Often Should I Actually Look at This Stuff?
For most local businesses, checking in monthly is the perfect rhythm. It's frequent enough to catch important trends and make smart adjustments, but not so often that you're reacting to every daily blip. Daily data can be a rollercoaster; you'll drive yourself crazy trying to make sense of insignificant fluctuations.
A monthly review gives your efforts—like a new batch of customer reviews or updates to a service page—enough time to actually show results. This approach turns your report into a powerful planning tool.
If I Only Care About One Thing, What Should It Be?
If you were to laser-focus on a single area, it has to be the conversions happening directly on your Google Business Profile (GBP). This is a small cluster of actions that show high-intent customers are ready to connect with you right now.
We're talking about the metrics that really matter:
- Phone Calls: Someone saw your listing and called you straight from Google. That's a hot lead.
- Direction Requests: A potential customer is literally mapping out a route to your front door.
- Website Clicks: A user actively clicked from your Google profile to your website, signaling they want to dig deeper.
Rankings are great for your ego, but these GBP interactions are the closest you'll get to tracking real-world results like new leads and foot traffic before a customer even lands on your website.
Why Are My Rankings Great But My Phone Isn't Ringing?
This is a frustratingly common scenario. Seeing your business at the top of Google but not seeing an uptick in sales can feel like you're spinning your wheels. This problem almost always boils down to one of two things.
First, you could be ranking for the wrong keywords. Your report might show you're #1 for "how to fix a leaky faucet," which attracts DIYers, not people looking to hire an "emergency plumber in Phoenix." Your reporting must tie keyword performance directly to business goals, like actual phone calls.
Second, your website might have a conversion problem. Getting the right traffic to your site is only half the battle. If your website is slow, hard to navigate, or doesn't have a clear call to action, all those potential customers will simply leave. The issue isn't your SEO at that point—it's the experience they have once they arrive.
Can I Do My Own Local SEO Reporting?
You absolutely can. With Google's free tools—Google Analytics, Google Business Profile, and Google Search Console—you have everything you need to build a solid reporting dashboard yourself. The trick is to stay disciplined and focus on the metrics that impact your bottom line.
The challenge isn't getting the data; it's knowing what to do with it. Pulling numbers is easy. The real skill is in understanding the story those numbers are telling about your customers and your business.
This is where having an experienced partner can be a game-changer. We dive deep into the analysis and connect the dots, turning raw data into a clear growth strategy. We see how your Google profile, your website, and your sales process all work together, making sure every piece of your digital presence is pulling in the same direction: growing your business.
At Uncommon Web Design, we don’t just build websites—we build growth engines. If you're ready to stop guessing and start making data-driven decisions that generate real leads and sales, let's talk.


